Pulse Data Hub

Tutorials

Data Dashboards

How to Build a Data Dashboard in 10 Minutes

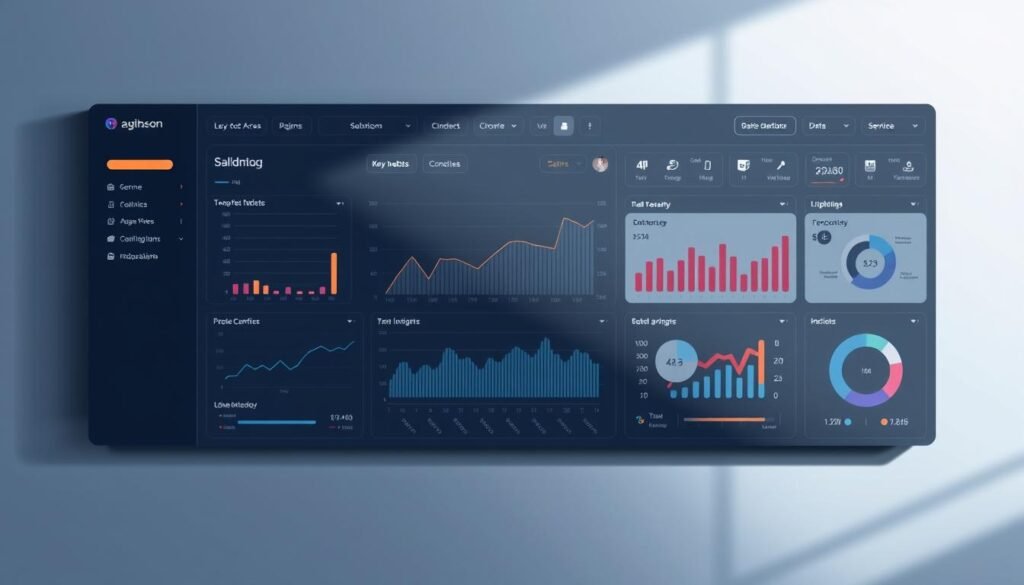
Data Dashboard solutions offer a quick and efficient way to track your business performance. In just 10 minutes, you can build a dashboard that saves time, streamlines data analysis, and supports smarter decision-making. Dashboards are vital tools for modern businesses—whether in marketing, sales, or operations. They help you visualize key metrics, monitor progress, and access […]

How to Build a Data Dashboard in 10 Minutes Read More »

NLP

How to Perform Natural Language Processing (NLP) with Python

Natural Language Processing or NLP is a fascinating field that bridges human language and computer understanding. It allows machines to interpret, analyze, and even generate text in ways that mimic human communication. With Python, this technology becomes accessible and powerful, enabling developers to create innovative solutions. At its core, NLP combines language processing techniques with

How to Perform Natural Language Processing (NLP) with Python Read More »

data visualization in R

Data Analysis with R Made Easy: A Simple Introduction

Data analysis has become a cornerstone of decision-making in various fields. One of the most powerful tools for this purpose is a programming language designed specifically for statistical computing and visualization. This language, known for its versatility, has gained immense popularity among data scientists and analysts. Originally developed in the 1990s, this language has evolved

Data Analysis with R Made Easy: A Simple Introduction Read More »

Tableau

How to Use Tableau for Data Visualization

In today’s data-driven world, turning complex information into clear insights is essential for any business. Data visualization plays a key role in this process, helping teams make smarter decisions. One of the most powerful tools for this is Tableau, a leading analytics platform trusted by organizations worldwide. Tableau simplifies the journey from raw data to

How to Use Tableau for Data Visualization Read More »

Machine Learning

Building Your First Machine Learning Model with Scikit-Learn

Getting started with machine learning can feel overwhelming, but it doesn’t have to be. With tools like Scikit-Learn, you can simplify the process and focus on what matters most: building your first model. Scikit-Learn is a powerful Python library designed to make machine learning accessible, even for beginners. This guide will walk you through the

Building Your First Machine Learning Model with Scikit-Learn Read More »

Sentiment Analysis

How to Perform Sentiment Analysis with Python

Understanding customer opinions is crucial for any business. Sentiment analysis helps you gauge how people feel about your brand, product, or service. By analyzing text data from reviews, social media, and surveys, you can gain valuable insights. Python is a powerful tool for this task. It supports both rule-based methods and machine learning models. Whether

How to Perform Sentiment Analysis with Python Read More »

Real-World Data

How to Analyze a Real-World Dataset with Python

Real-world dataset provide practical insights and challenges, making them ideal for learning data analysis and testing machine learning models. Python has become a powerful tool for analyzing complex datasets, especially in fields like healthcare and clinical research. Its versatility allows researchers to process large volumes of information efficiently. From electronic health records (EHR) to clinical

How to Analyze a Real-World Dataset with Python Read More »

Time Series Analysis

Stock Price Prediction Made Easy with Python Time Series Models

Understanding patterns in data is essential for making informed decisions, especially in finance. A time series is a sequence of data points collected over regular intervals. This method helps analyze trends, such as the daily closing values of stock indexes like the Dow Jones Industrial Average. In this article, we’ll explore how time series analysis

Stock Price Prediction Made Easy with Python Time Series Models Read More »

Spark

How to Use Apache Spark for Big Data Analysis

Apache Spark™ is a powerful tool for handling large-scale data analytics. It’s known for its simplicity, speed, and scalability. Whether you’re working with batch or streaming data, this platform delivers exceptional performance. One of its standout features is its support for multiple programming languages. You can use Python, SQL, Scala, Java, or R, making it

How to Use Apache Spark for Big Data Analysis Read More »

Verified by MonsterInsights