
The Kaggle Titanic competition is the standard first machine learning project, and it teaches one lesson most guides skip: a one-line rule gets 78.7% of the way there, and a lot of feature engineering moves the score by only a few points. This tutorial runs the competition’s training data through seven feature sets, measures what each one adds with repeated cross-validation, and then builds a submission file. Everything ran on 22 November 2026 with Python 3.13, pandas 3.0.5 and scikit-learn 1.9.1.
What is the Kaggle Titanic competition?
Titanic: Machine Learning from Disaster gives you a table of 891 passengers with their outcome (survived or not) and asks you to predict survival for 418 other passengers whose outcomes Kaggle keeps hidden. You upload a CSV with two columns, PassengerId and Survived, and Kaggle scores it by accuracy.
Two honest notes on what we did. First, Kaggle’s own site is not reachable from the machine we run our code on, so we loaded the same files from a public GitHub copy of the competition data (891 training rows, 418 test rows, identical columns). For your own work, download the files from Kaggle and follow the competition rules. Second, we cannot see your leaderboard score. All accuracy numbers here are cross-validation on the 891 training rows, not Kaggle scores.
Step 1: look at the data and the missing values
import numpy as np, pandas as pd
from sklearn.model_selection import RepeatedStratifiedKFold, cross_val_score
from sklearn.pipeline import make_pipeline
from sklearn.compose import make_column_transformer
from sklearn.preprocessing import OneHotEncoder, StandardScaler
from sklearn.impute import SimpleImputer
from sklearn.linear_model import LogisticRegression
from sklearn.ensemble import RandomForestClassifier

URL = "https://raw.githubusercontent.com/agconti/kaggle-titanic/master/data/train.csv"
df = pd.read_csv(URL)   # or "train.csv" downloaded from Kaggle
print(df.shape, "survived", round(df.Survived.mean(), 3))
print(df.isna().sum()[lambda s: s > 0].to_dict())
(891, 12) survived 0.384
{'Age': 177, 'Cabin': 687, 'Embarked': 2}Only 38.4% survived, so guessing “died” for everyone is right 61.6% of the time. That is the baseline to beat. Age is missing for 177 passengers, Cabin for 687 (77%) and Embarked for 2. We will fill the first and last inside the model pipeline, so the fill values are learned only from training folds, which avoids leaking information from the test folds. Our scikit-learn tutorial shows why that matters.
Step 2: engineer features from names and families
Names look useless, but each one contains a title (“Mr”, “Mrs”, “Miss”, “Master”) that captures sex, marital status and age group in one word. We also add family size (siblings and spouses plus parents and children plus the passenger) and a flag for a known cabin.
df["Title"] = df.Name.str.extract(r",\s*([^.]+)\.", expand=False).str.strip()
common = {"Mr", "Mrs", "Miss", "Master"}
df["Title"] = df.Title.where(df.Title.isin(common), "Rare")   # Dr, Rev, Col, ...
df["Family"] = df.SibSp + df.Parch + 1
df["HasCabin"] = df.Cabin.notna().astype(int)
print(df.groupby("Title").Survived.agg(["mean", "size"]).round(3).to_dict("index"))
print(df.groupby("Family").Survived.agg(["mean", "size"]).round(3).loc[[1, 2, 3, 4, 5, 7]].to_dict("index"))
{'Master': {'mean': 0.575, 'size': 40}, 'Miss': {'mean': 0.698, 'size': 182}, 'Mr': {'mean': 0.157, 'size': 517},
'Mrs': {'mean': 0.792, 'size': 125}, 'Rare': {'mean': 0.444, 'size': 27}}
{1: {'mean': 0.304, 'size': 537}, 2: {'mean': 0.553, 'size': 161}, 3: {'mean': 0.578, 'size': 102},
4: {'mean': 0.724, 'size': 29}, 5: {'mean': 0.2, 'size': 15}, 7: {'mean': 0.333, 'size': 12}}Titles separate groups that “Sex” cannot: 57.5% of boys (Master) survived against 15.7% of adult men (Mr), and married women (Mrs) did better than unmarried ones (79.2% against 69.8%). Family size is not a straight line: passengers travelling alone had a 30.4% survival rate, families of two to four did much better (55.3% to 72.4%), and families of five or more did worse (20.0% for five, 33.3% for seven). Many of the largest groups are small, so treat the exact figures with care.
Step 3: measure each feature set properly
A single train/test split on 891 rows is too noisy to rank features, because the accuracy can move by two points on a different split. We use five-fold cross-validation repeated five times (25 scores per model) and report the mean. The function below rebuilds the whole pipeline for each feature set, with a logistic regression and a random forest.
cv = RepeatedStratifiedKFold(n_splits=5, n_repeats=5, random_state=0)
def score(num, cat, model="lr"):
    pre = make_column_transformer(
        (make_pipeline(SimpleImputer(strategy="median"), StandardScaler()), num),
        (make_pipeline(SimpleImputer(strategy="most_frequent"), OneHotEncoder(handle_unknown="ignore")), cat))
    clf = LogisticRegression(max_iter=2000) if model == "lr" else RandomForestClassifier(300, min_samples_leaf=3, random_state=0)
    s = cross_val_score(make_pipeline(pre, clf), df[num + cat], df.Survived, cv=cv)
    return round(s.mean(), 4), round(s.std(), 3)

print("majority", round(1 - df.Survived.mean(), 4))
print("sex rule", round(((df.Sex == "female") == (df.Survived == 1)).mean(), 4))
steps = [
    ("Sex", [], ["Sex"]),
    ("+ Pclass", ["Pclass"], ["Sex"]),
    ("+ Age, Fare", ["Pclass", "Age", "Fare"], ["Sex"]),
    ("+ Embarked", ["Pclass", "Age", "Fare"], ["Sex", "Embarked"]),
    ("+ Title", ["Pclass", "Age", "Fare"], ["Sex", "Embarked", "Title"]),
    ("+ Family size", ["Pclass", "Age", "Fare", "Family"], ["Sex", "Embarked", "Title"]),
    ("+ HasCabin", ["Pclass", "Age", "Fare", "Family", "HasCabin"], ["Sex", "Embarked", "Title"]),
]
for name, num, cat in steps:
    print(f"{name:15s} logistic {score(num, cat)}  forest {score(num, cat, 'rf')}")
(The “Family” column used above is the Family feature from step 2, created with df["Family"] = df.SibSp + df.Parch + 1.) Results, as accuracy (mean, standard deviation):
majority 0.6162
sex rule 0.7868
Sex             logistic (0.7867, 0.033)  forest (0.7867, 0.033)
+ Pclass        logistic (0.7867, 0.033)  forest (0.7749, 0.026)
+ Age, Fare     logistic (0.7903, 0.031)  forest (0.8321, 0.026)
+ Embarked      logistic (0.7885, 0.03)   forest (0.8258, 0.023)
+ Title         logistic (0.7995, 0.035)  forest (0.837, 0.019)
+ Family size   logistic (0.8262, 0.024)  forest (0.833, 0.023)
+ HasCabin      logistic (0.8278, 0.023)  forest (0.8319, 0.023)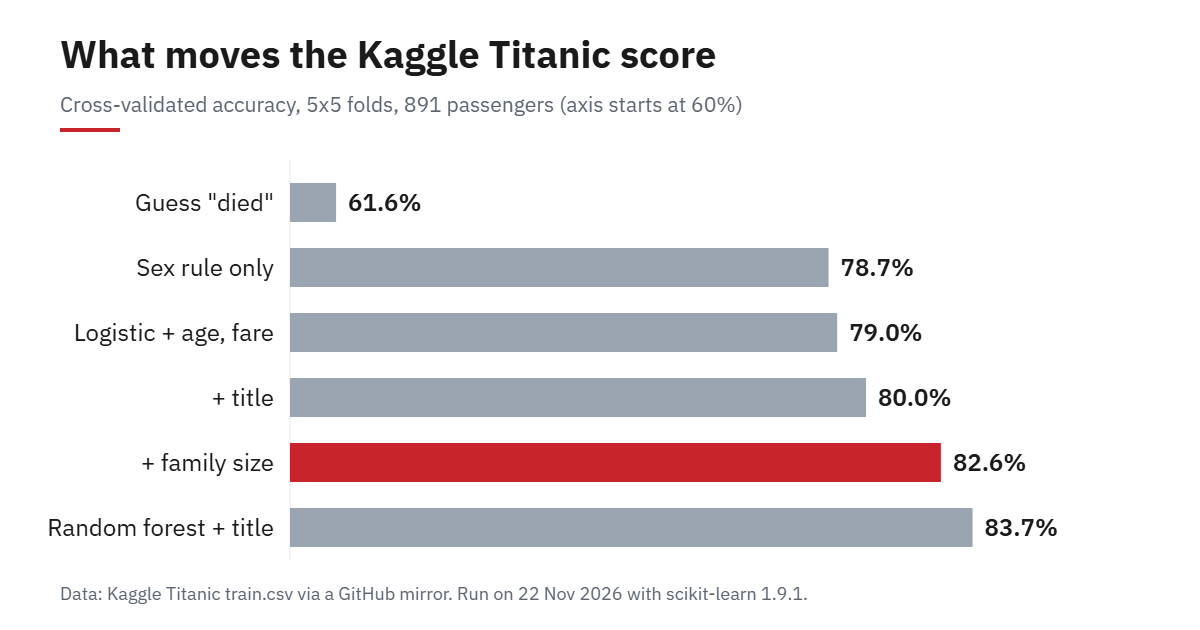
What the numbers say about the Titanic score
- Sex does most of the work. The rule “women survive, men die” scores 78.7%, and a logistic regression on sex alone scores 78.7% too. Adding passenger class changes nothing for the logistic model in these tests.
- Family size is the biggest single gain for the logistic model. It rises from 80.0% to 82.6%, +2.7 points, which fits the non-linear pattern we saw in step 2 (alone and large families did worse than small ones).
- The random forest finds most of this by itself. With only sex, class, age and fare it already reaches 83.2%, and it peaks at 83.7% with the title. Adding family size or a cabin flag does not help it, and on this data both models end up around 83%.
- Most steps are within noise. The standard deviation across the 25 folds is 0.02 to 0.035, so a change of one point or less, such as adding Embarked, is not evidence of anything.
The practical lesson: after a handful of features, further tuning on 891 rows mostly fits noise. If you see a public notebook claiming 90% or more on the training data, check how it validated. See our random forests tutorial for why a forest overfits easily, and exploratory data analysis in Python for finding patterns like the title effect before modelling.
Step 4: create the Kaggle submission file
To submit, fit the chosen model on all 891 rows, predict the 418 test passengers and save a two-column CSV. We use the logistic regression with title and family size (82.6% in cross-validation), applying exactly the same feature code to the test file:
TEST = "https://raw.githubusercontent.com/agconti/kaggle-titanic/master/data/test.csv"
test = pd.read_csv(TEST)
def add_features(d):
    d["Title"] = d.Name.str.extract(r",\s*([^.]+)\.", expand=False).str.strip()
    d["Title"] = d.Title.where(d.Title.isin(common), "Rare")
    d["Family"] = d.SibSp + d.Parch + 1
    return d
test = add_features(test)
num, cat = ["Pclass", "Age", "Fare", "Family"], ["Sex", "Embarked", "Title"]
pre = make_column_transformer(
    (make_pipeline(SimpleImputer(strategy="median"), StandardScaler()), num),
    (make_pipeline(SimpleImputer(strategy="most_frequent"), OneHotEncoder(handle_unknown="ignore")), cat))
final = make_pipeline(pre, LogisticRegression(max_iter=2000)).fit(df[num + cat], df.Survived)
sub = pd.DataFrame({"PassengerId": test.PassengerId, "Survived": final.predict(test[num + cat])})
sub.to_csv("submission.csv", index=False)
print(test.shape, "test rows | predicted survival rate", round(sub.Survived.mean(), 3), "| missing in test: Age", int(test.Age.isna().sum()), "Fare", int(test.Fare.isna().sum()))
print(sub.head(3).to_string(index=False))
(418, 13) test rows | predicted survival rate 0.404 | missing in test: Age 86 Fare 1
PassengerId Survived
892 0
893 1
894 0The predicted survival rate of 40.4% is close to the 38.4% in the training data, which is a sensible sanity check. The test file also has missing values (86 ages and one fare), which the pipeline fills with the training medians. Upload submission.csv on the competition’s Submit page. We have not uploaded it, so we make no claim about the leaderboard score.
Is the Kaggle Titanic competition worth your time?
Yes, as a first project, with limits. It teaches missing values, feature engineering, cross-validation and the discipline of a baseline on a data set small enough to finish in an evening. It does not teach large data, deployment or messy business questions. When you are done, move to a larger project such as the ones in our data science projects for beginners, and put your repository on GitHub as shown in Git and GitHub for data science.
FAQ
What is a good score on Kaggle Titanic?
In our cross-validation on the training data, guessing “died” scores 61.6%, a sex-only rule scores 78.7%, and good models score about 83%. Leaderboard scores differ because the 418 test passengers are a different sample, so do not expect your leaderboard number to match.
Which features matter most for Titanic survival?
Sex first, then title (which captures age group and marital status) and family size. Passenger class and fare matter, but mostly overlap with those. Adding more features beyond these gave no reliable gain in our tests.
Should I use logistic regression or a random forest for Titanic?
Both end near 83% once the right features exist. The forest needs less feature work, the logistic regression is easier to explain. Use cross-validation, repeated several times, to compare them, because single splits are too noisy on 891 rows.
Can I use the Titanic data outside Kaggle?
The competition data is provided for the competition, so read the data section of its rules page before republishing it. Similar passenger data is also available in open libraries such as seaborn.
