
Data science projects for beginners work best when each one answers a single question with a real data set, a baseline and one honest result. This guide gives you five such projects: predict Titanic survival, predict diamond prices, cluster penguins, forecast airline passengers and chart life expectancy against income. Every project is under 20 lines of Python, and we ran all of them on 21 November 2026 (Python 3.13, pandas 3.0.5, scikit-learn 1.9.1, seaborn 0.13.2, Plotly 7.1.0). The numbers shown are the actual outputs, including the unflattering ones.
What makes a good beginner data science project?
A good project has four parts: a clear question, a public data set anyone can download, a baseline that a lazy approach would score, and a result you can explain in one sentence. Without the baseline you cannot tell whether your model learned anything. Three of the five projects below end with a surprise, and that is the point: finding out why a result surprised you is where learning happens.
The five projects at a glance
| Project | Skill | Data | Result we measured |
|---|---|---|---|
| 1. Titanic survival | Classification | 891 passengers | 78.6% accuracy vs 61.6% baseline |
| 2. Diamond prices | Regression | 53,920 diamonds | $289 error vs $3,049 for guessing |
| 3. Penguin clusters | Clustering | 333 penguins | ARI 0.799 scaled vs 0.316 unscaled |
| 4. Airline forecast | Time series | 144 months | MAE 51.5 vs 115.2 for last value |
| 5. Life expectancy | Visualisation | 142 countries | Correlation 0.809 with log income |
All data sets load with one line from the seaborn-data repository or from Plotly’s built-in data, so there is nothing to sign up for. Install the tools with pip install pandas scikit-learn seaborn plotly; if you do not have a working setup yet, follow our Python and Jupyter installation guide first.
import numpy as np, pandas as pd, seaborn as sns
from sklearn.model_selection import train_test_split, cross_val_score
from sklearn.linear_model import LogisticRegression, LinearRegression
from sklearn.ensemble import HistGradientBoostingRegressor
from sklearn.preprocessing import StandardScaler
from sklearn.cluster import KMeans
from sklearn.metrics import adjusted_rand_score, mean_absolute_error
from sklearn.pipeline import make_pipeline
import plotly.express as px
Project 1: Titanic survival (classification)
Question: which passengers survived the Titanic? Start with the simplest facts: 38.4% of the 891 passengers survived, 74.2% of women but only 18.9% of men, and 63.0% of first-class passengers against 24.2% in third class. Then train a logistic regression on class, sex, age and fare. Age is missing for 177 passengers, which we fill with the median.
t = sns.load_dataset("titanic")
print(t.shape, "survived", round(t.survived.mean(), 3))
print(t.groupby("sex").survived.mean().round(3).to_dict(), t.groupby("pclass").survived.mean().round(3).to_dict())
X = pd.get_dummies(t[["pclass", "sex", "age", "fare"]], drop_first=True).astype(float)
X["age"] = X["age"].fillna(X["age"].median())
lr = make_pipeline(StandardScaler(), LogisticRegression(max_iter=1000))
print("majority", round(max(t.survived.mean(), 1 - t.survived.mean()), 3),
      "| logistic CV acc", round(cross_val_score(lr, X, t.survived, cv=5).mean(), 3))
print("sex-only rule acc", round(((t.sex == "female") == (t.survived == 1)).mean(), 3))
(891, 15) survived 0.384
{'female': 0.742, 'male': 0.189} {1: 0.63, 2: 0.473, 3: 0.242}
majority 0.616 | logistic CV acc 0.786
sex-only rule acc 0.787Result: the model beats the 61.6% baseline with 78.6% cross-validated accuracy. But a one-line rule, “women survive, men do not”, scores 78.7%, as good as the model. For a beginner, that is the most useful lesson in the project: always compare a model with the simplest rule you can write. To go further, see our random forests tutorial, which uses the same data and gets higher.
Project 2: diamond prices (regression)
Question: how well can carat, cut, colour and clarity predict a diamond’s price? We remove 20 rows with a zero dimension, hold out 20% of the 53,920 diamonds and compare three predictors by mean absolute error in dollars.
d = sns.load_dataset("diamonds")
d = d[(d.x > 0) & (d.y > 0) & (d.z > 0)]
X = pd.get_dummies(d.drop(columns="price"), drop_first=True).astype(float)
Xtr, Xte, ytr, yte = train_test_split(X, d.price, test_size=0.2, random_state=0)
print(len(d), "rows; mean price", round(d.price.mean()))
print("MAE mean guess", round(mean_absolute_error(yte, np.full(len(yte), ytr.mean()))),
      "| linear", round(mean_absolute_error(yte, LinearRegression().fit(Xtr, ytr).predict(Xte))),
      "| boosting", round(mean_absolute_error(yte, HistGradientBoostingRegressor(random_state=0).fit(Xtr, ytr).predict(Xte))))
53920 rows; mean price 3931
MAE mean guess 3049 | linear 742 | boosting 289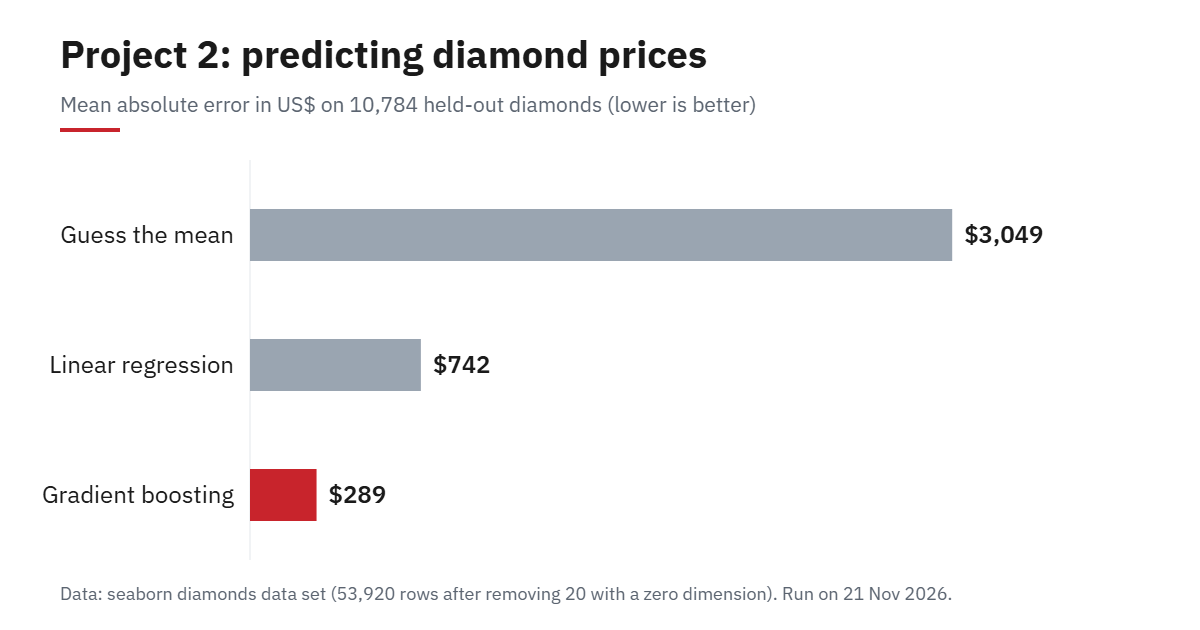
Result: guessing the average price is off by $3,049 on a typical diamond. Linear regression cuts that to $742, and gradient boosting to $289, a 90% reduction against guessing. Price does not rise in a straight line with carat, which probably explains why the tree-based model wins. Our scikit-learn tutorial explains how to split, evaluate and avoid leakage properly.
Project 3: penguin clusters (unsupervised learning)
Question: can k-means find the three penguin species without being told the labels? We use bill length, bill depth, flipper length and body mass for 333 penguins, and compare the result with the true species using the adjusted Rand index (1.0 is a perfect match, 0 is random).
p = sns.load_dataset("penguins").dropna()
cols = ["bill_length_mm", "bill_depth_mm", "flipper_length_mm", "body_mass_g"]
km = KMeans(3, n_init=10, random_state=0)
raw = km.fit_predict(p[cols]); sc = km.fit_predict(StandardScaler().fit_transform(p[cols]))
print(len(p), "ARI raw", round(adjusted_rand_score(p.species, raw), 3), "scaled", round(adjusted_rand_score(p.species, sc), 3))
333 ARI raw 0.316 scaled 0.799Result: without scaling, k-means mostly sorts penguins by body mass, because that column has by far the largest numbers and dominates the distances, and scores 0.316. After standardising each column it scores 0.799. Scaling is not a detail with distance-based methods. The full story is in our k-means clustering guide.
Project 4: forecast airline passengers (time series)
Question: can you forecast the next two years of monthly airline passengers (1949 to 1960) with simple rules? We hold out the last 24 months and compare three forecasts: repeat the last value, repeat the same month from last year, and repeat last year scaled by its yearly growth.
f = sns.load_dataset("flights"); s = f.passengers
train, test = s[:-24], s[-24:]
naive = np.full(24, train.iloc[-1])
seas = np.tile(train.iloc[-12:].values, 2)
growth = train.iloc[-12:].sum() / train.iloc[-24:-12].sum()
seas_g = np.concatenate([train.iloc[-12:].values * growth, train.iloc[-12:].values * growth ** 2])
print(len(f), "months | MAE last value", round(mean_absolute_error(test, naive), 1),
      "| same month last year", round(mean_absolute_error(test, seas), 1),
      "| with growth", round(mean_absolute_error(test, seas_g), 1), "| growth", round(growth, 3))
144 months | MAE last value 115.2 | same month last year 71.2 | with growth 51.5 | growth 1.034Result: respecting the yearly pattern cuts the error from 115.2 to 71.2 passengers, and adding growth lowers it to 51.5. Note that the measured growth of 3.4% is far below what happened next (yearly totals rose 12.4% in 1959 and 11.1% in 1960), so this forecast still under-predicts. The tutorial on time series analysis in Python adds proper models.
Project 5: life expectancy and income (data visualisation)
Question: how strongly is life expectancy tied to income? The Gapminder data in Plotly has 142 countries for 2007. On a log income scale the correlation is 0.809, and the median life expectancy runs from 52.9 years in Africa to 80.7 in Oceania.
g = px.data.gapminder(); g07 = g[g.year == 2007]
print(len(g07), "countries; corr life vs log income", round(np.corrcoef(np.log10(g07.gdpPercap), g07.lifeExp)[0, 1], 3))
print(g07.groupby("continent").lifeExp.median().round(1).to_dict())
px.scatter(g07, x="gdpPercap", y="lifeExp", size="pop", color="continent",
           hover_name="country", log_x=True).show()
142 countries; corr life vs log income 0.809
{'Africa': 52.9, 'Americas': 72.9, 'Asia': 72.4, 'Europe': 78.6, 'Oceania': 80.7}Result: a strong relationship, shown best as an interactive chart. Our guide to interactive visualizations with Plotly builds this exact chart and tests its hover and legend behaviour.
How do I turn these into a portfolio?
Put each project in its own Git repository with a README that states the question, the data source, the baseline and your result in one sentence, as we show in Git and GitHub for data science. Then change something: use a different data set, add a better baseline, or explain a failure. Employers care less about a perfect score than about whether you can say why the result is what it is. For more raw material, see how to analyse a real-world dataset from scratch.
FAQ
What are good data science projects for beginners?
Projects with a clear question, a public data set and a baseline: Titanic survival (classification), diamond prices (regression), penguin clustering, airline passenger forecasting and a life expectancy chart. Each can be done in under 20 lines of Python.
How long does a beginner data science project take?
The five projects here each take 30 to 60 minutes if you already have Python installed. The code runs in seconds; the time goes into understanding the data and the result.
Which data sets are best for beginner projects?
Small, clean, well-documented data sets such as Titanic (891 rows), penguins (333 rows) and diamonds (53,920 rows). All are available through seaborn without registration.
Do I need machine learning for a data science project?
No. A strong project can be pure analysis and visualisation, like Project 5. When you do use a model, always compare it with a simple baseline, because in our Titanic project a one-line rule matched the model.
